Visualize Predictions
The plot() method allows you to visualize predictions from a detection or segmentation model.
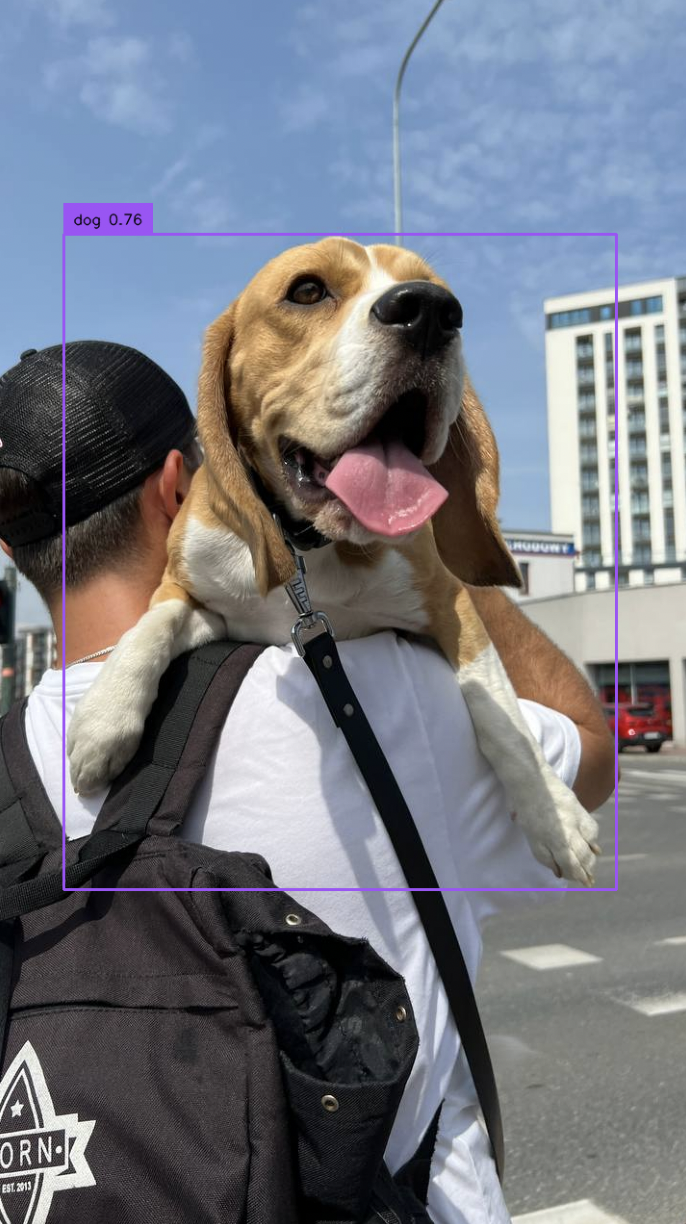
If you use a detection model to run inference (i.e. Grounding DINO), the plot() method will plot bounding boxes for each prediction.
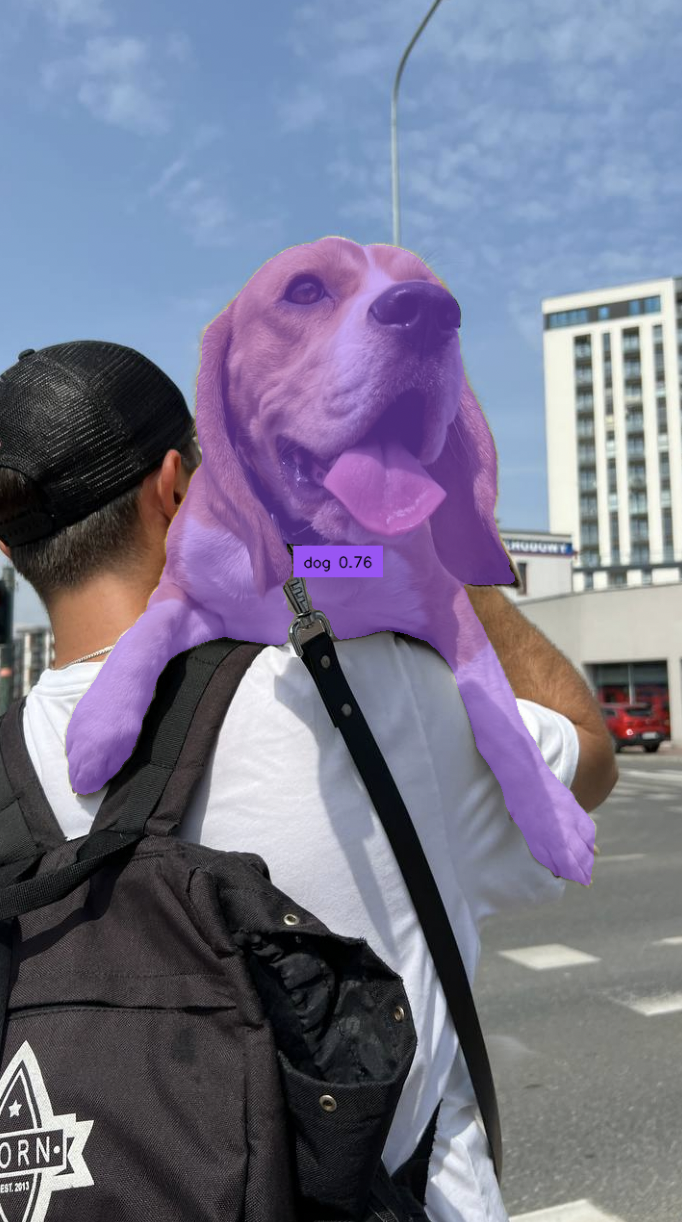
If you use a segmentation model to run inference (i.e. Grounded SAM), the plot() method will plot segmentation masks for each prediction.
Here is an example of the method used to annotate predictions from a Grounding DINO model:
from autodistill_grounding_dino import GroundingDINO
from autodistill.detection import CaptionOntology
from autodistill.utils.plot import plot
import cv2

ontology = CaptionOntology(
    {
        "dog": "dog",
    }
)

model = GroundingDINO(ontology=ontology)

result = model.predict("./dog.jpeg")

plot(
    image=cv2.imread("./dog.jpeg"),
    classes=base_model.ontology.classes(),
    detections=result
)
from autodistill_grounded_sam import GroundedSAM
from autodistill.detection import CaptionOntology
from autodistill.utils import plot
import cv2

ontology = CaptionOntology(
    {
        "dog": "dog",
    }
)

model = GroundedSAM(ontology=ontology)

result = model.predict("./dog.jpeg")

plot(
    image=cv2.imread("./dog.jpeg"),
    classes=model.ontology.classes(),
    detections=result
)
Code Reference
Plot bounding boxes or segmentation masks on an image.
Parameters:
| Name | Type | Description | Default |
|---|---|---|---|
image |
np.ndarray
|
The image to plot on |
required |
detections |
The detections to plot |
required | |
classes |
List[str]
|
The classes to plot |
required |
raw |
Whether to return the raw image or plot it interactively |
False
|
Returns:
| Type | Description |
|---|---|
|
The raw image (np.ndarray) if raw=True, otherwise None (image is plotted interactively |
Source code in autodistill/utils.py
47 48 49 50 51 52 53 54 55 56 57 58 59 60 61 62 63 64 65 66 67 68 69 70 71 72 73 74 75 76 77 78 79 80 81 82 | |